What it measures
% difference in average pay between male and female employees
The gap is calculated annually based on historical payroll data, reflecting hiring, promotion, and compensation decisions made over the preceding 12 months. The result confirms a problem long after the causal decisions are locked in.
Business impact
- Increased 'chaos tax' from talent churn: higher recruitment agency fees, premium pay for temporary cover, and customer service commitment failures due to understaffed planning teams.
- Degraded inventory position and higher write-offs, as high turnover in planning and logistics roles—often a symptom of a poor culture flagged by the pay gap—leads to inconsistent S&OP execution.
Formula
(Male avg pay - Female avg pay) / Male avg pay x 100Grain
One row per employee per month — employee × site × cost centre × period
Inside the Implementation Pack
A preview of what's actually built for this KPI — extracted from the real Implementation Pack, not a mockup.
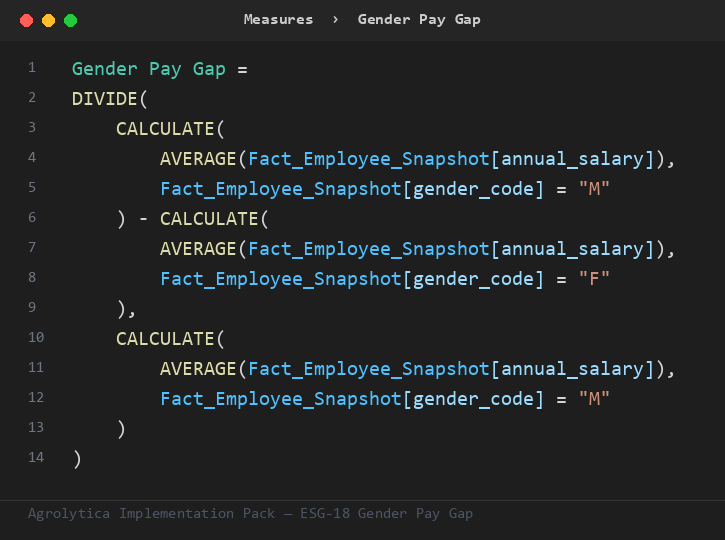
This is the primary ratio the pack's other measures build on — trend, rank, and period-comparison variants, all on Fact_Employee_Snapshot. Two independently-filtered CALCULATE blocks, not a simple ratio of raw sums.
Fact_Employee_Snapshot— 7 mandatory columns — period key, cost center key, ...Dim_Cost_Center— key + nameDim_Employee— key + nameDim_Period— key + nameDim_Plant— key + nameDim_Site— key + nameDim_Date— Auto-generated calendar table — no customer data required
Full field-by-field data contract, in 4 SQL dialects (SQL Server, Snowflake, Databricks, BigQuery), ships in the pack.
| Target | 0.05 — performance considered compliant at or below this line |
| Warning | 0.12 — amber alert — triggers a review |
Both live in one Excel tab — change them, refresh the report, done. No DAX editing needed.
Everything you need to build Gender Pay Gap in Power BI — dimensional model, DAX measures, SQL views, and a food-industry demo dataset.