What it measures
% of year-1 savings maintained in year 2
this KPI measures the outcome of procurement decisions made 12-24 months prior. The savings erosion has already occurred and hit the P&L before the score is calculated.
Business impact
- Increased 'chaos tax' from unreliable suppliers: emergency raw material purchases, unplanned production schedule changes, and quality holds that disrupt the entire supply plan.
- A sourcing 'saving' that increases Minimum Order Quantity (MOQ) inflates the inventory position, tying up cash and increasing the risk of write-offs that can exceed the initial price benefit.
- Sustained low performance indicates a pattern of selecting unreliable suppliers, whose poor OTIF and quality will trigger retailer service-level penalties and place key accounts in the delisting zone.
Formula
(Year 2 savings / Year 1 savings) x 100Grain
One row per supplier per category per period
Inside the Implementation Pack
A preview of what's actually built for this KPI — extracted from the real Implementation Pack, not a mockup.
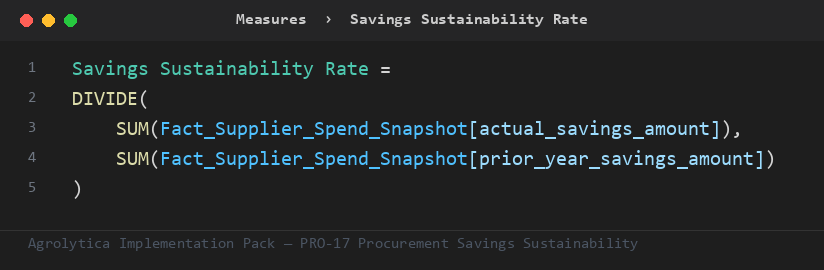
This is the primary ratio the pack's other measures build on — trend, rank, and period-comparison variants, all on Fact_Supplier_Spend_Snapshot.
Fact_Supplier_Spend_Snapshot— 6 mandatory columns — plant key, actual savings amount, ...Dim_Commodity— key + nameDim_Period— key + nameDim_Plant— key + nameDim_Supplier— key + nameDim_Date— Auto-generated calendar table — no customer data required
Full field-by-field data contract, in 4 SQL dialects (SQL Server, Snowflake, Databricks, BigQuery), ships in the pack.
| Target | 0.9 — performance considered compliant at or above this line |
| Warning | 0.65 — amber alert — triggers a review |
Both live in one Excel tab — change them, refresh the report, done. No DAX editing needed.
Everything you need to build Procurement Savings Sustainability in Power BI — dimensional model, DAX measures, SQL views, and a food-industry demo dataset.