What it measures
% of packaging made from recycled materials
the percentage is calculated based on materials already purchased and used in a prior period; it confirms past performance, it does not predict future compliance or cost exposure.
Business impact
- A 1-point drop below a regulatory threshold like the UK's 30% for plastics can trigger packaging tax liabilities equivalent to 0.1-0.3% of net revenue on that product line — felt first by the Finance Controller as an un-forecasted cost.
- Increased 'chaos tax' from running less stable recycled materials: higher scrap rates, more frequent line stops for adjustments, and reduced effective line capacity, all hitting the conversion cost per unit.
- Negative working capital impact from dual inventory positions, holding both virgin and recycled variants for key packaging lines to mitigate the risk of line stoppages, tying up cash and warehouse space.
- Failure to meet retailer scorecard requirements for recycled content places the business on a formal review track, creating a direct risk of range reduction or delisting at the next category review.
Formula
(Recycled material weight / Total packaging weight) x 100Grain
One row per finished product per packaging component per period
Inside the Implementation Pack
A preview of what's actually built for this KPI — extracted from the real Implementation Pack, not a mockup.
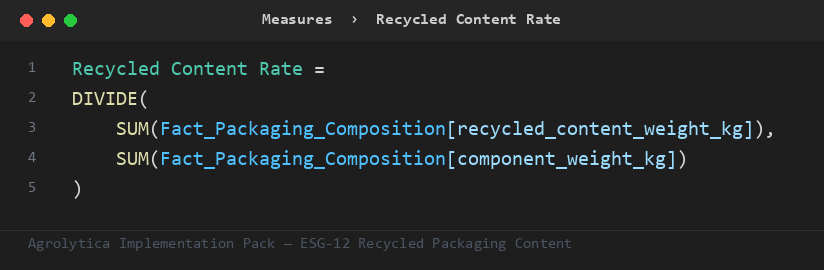
This is the primary ratio the pack's other measures build on — trend, rank, and period-comparison variants, all on Fact_Packaging_Composition.
Fact_Packaging_Composition— 6 mandatory columns — supplier key, product key, ...Dim_Material— material_key + material_descriptionDim_Period— key + nameDim_Product— key + nameDim_Supplier— key + nameDim_Date— Auto-generated calendar table — no customer data required
Full field-by-field data contract, in 4 SQL dialects (SQL Server, Snowflake, Databricks, BigQuery), ships in the pack.
| Target | 0.5 — performance considered compliant at or above this line |
| Warning | 0.4 — amber alert — triggers a review |
Both live in one Excel tab — change them, refresh the report, done. No DAX editing needed.
Everything you need to build Recycled Packaging Content in Power BI — dimensional model, DAX measures, SQL views, and a food-industry demo dataset.