What it measures
% of annual procurement savings target delivered
savings are typically verified and reported by Finance weeks or months after the sourcing decision was made and the materials were purchased, confirming past performance rather than predicting future outcomes.
Business impact
- Chasing savings on price alone creates a 'chaos tax' in the factory: line stoppages from out-of-spec materials, unplanned changeovers, and expedited freight to cover for unreliable suppliers.
- Focusing on unit price without considering total cost leads to poor quality materials that increase rework, reduce yield, and generate finished goods write-offs, destroying working capital.
- Sustained failure to deliver planned savings forces reactive, margin-eroding price increases to customers or a cut in investment, damaging commercial relationships and long-term capability.
Formula
(Actual savings / Target savings) x 100Grain
One row per purchase order line — supplier × material × commodity × plant × date
Inside the Implementation Pack
A preview of what's actually built for this KPI — extracted from the real Implementation Pack, not a mockup.
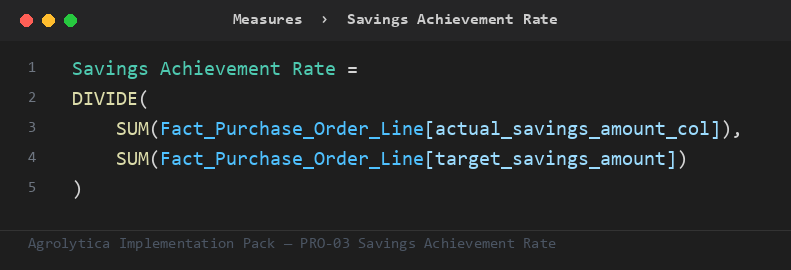
This is the primary ratio the pack's other measures build on — trend, rank, and period-comparison variants, all on Fact_Purchase_Order_Line.
Fact_Purchase_Order_Line— 8 mandatory columns — actual savings amount col, supplier key, ...Dim_Commodity— key + nameDim_Material— material_key + material_descriptionDim_Plant— key + nameDim_Supplier— key + nameDim_Date— Auto-generated calendar table — no customer data required
Full field-by-field data contract, in 4 SQL dialects (SQL Server, Snowflake, Databricks, BigQuery), ships in the pack.
| Target | 1 — performance considered compliant at or above this line |
| Warning | 0.85 — amber alert — triggers a review |
Both live in one Excel tab — change them, refresh the report, done. No DAX editing needed.
Everything you need to build Savings Achievement Rate in Power BI — dimensional model, DAX measures, SQL views, and a food-industry demo dataset.