What it measures
% of spend with top 3 suppliers
This KPI is a leading indicator of supply chain fragility. A high concentration score today predicts a higher probability of a future line stop, cost spike, or service failure weeks or months before it occurs, as it measures the structural risk embedded in the supply base.
Business impact
- Increased 'chaos tax' from supply disruptions: premium freight for emergency air shipments, unplanned line changeovers to run alternative products, and overtime for planning teams scrambling to re-schedule production.
- Bloated inventory position on critical materials, as high safety stock becomes the only buffer against a single point of failure. This ties up working capital and increases the risk of write-offs from obsolescence or expiry.
- Sustained single-source dependency on a core ingredient puts the business in the delisting zone. A failure to supply a key retailer for two consecutive weeks triggers a formal service review and jeopardizes the entire account.
Formula
(Top 3 supplier spend / Total spend) x 100Grain
One row per supplier per category per period
Inside the Implementation Pack
A preview of what's actually built for this KPI — extracted from the real Implementation Pack, not a mockup.
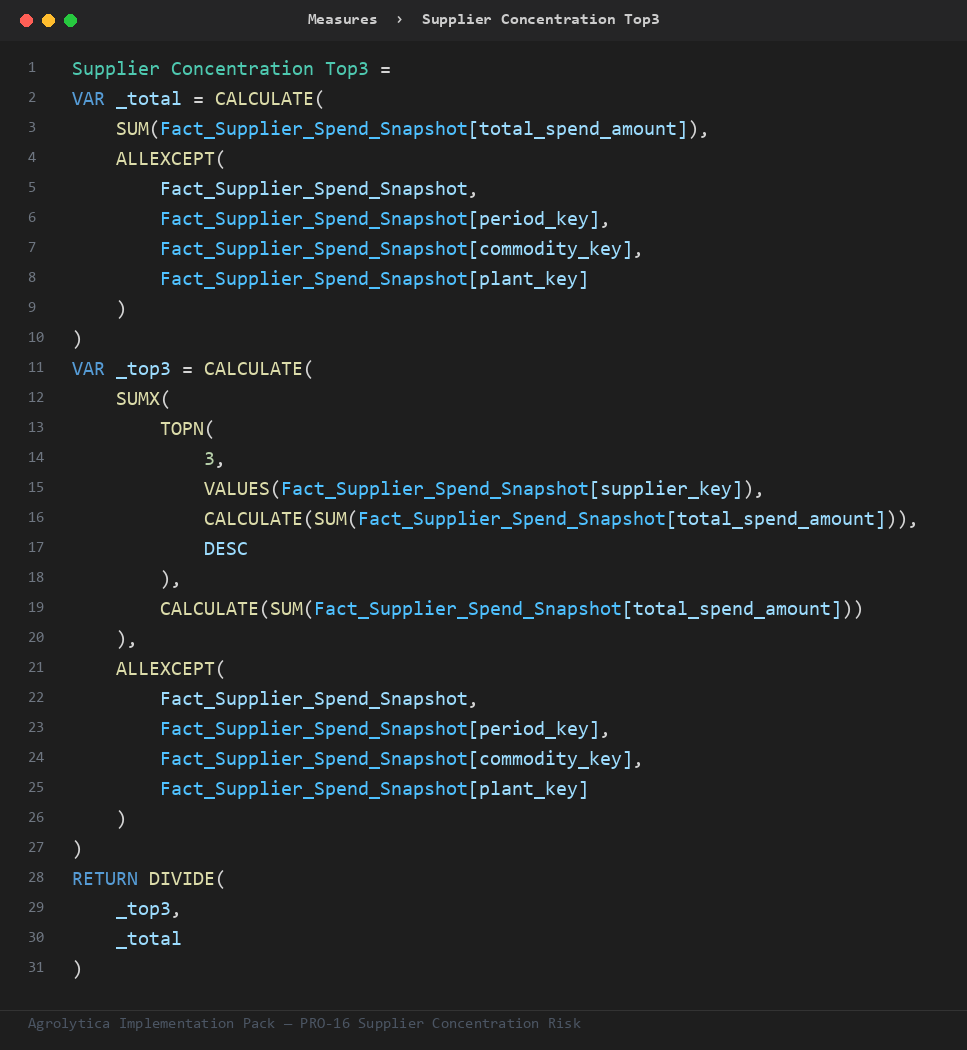
This is the primary ratio the pack's other measures build on — trend, rank, and period-comparison variants, all on Fact_Supplier_Spend_Snapshot. It uses VAR/RETURN to keep the logic readable instead of one giant nested expression.
Fact_Supplier_Spend_Snapshot— 5 mandatory columns — plant key, commodity key, ...Dim_Commodity— key + nameDim_Period— key + nameDim_Plant— key + nameDim_Supplier— key + nameDim_Date— Auto-generated calendar table — no customer data required
Full field-by-field data contract, in 4 SQL dialects (SQL Server, Snowflake, Databricks, BigQuery), ships in the pack.
| Target | 0.4 — performance considered compliant at or below this line |
| Warning | 0.55 — amber alert — triggers a review |
Both live in one Excel tab — change them, refresh the report, done. No DAX editing needed.
Everything you need to build Supplier Concentration Risk in Power BI — dimensional model, DAX measures, SQL views, and a food-industry demo dataset.