What it measures
% of temperature-sensitive shipments with excursions
The excursion is measured after the shipment is complete, often days later when data loggers are returned and read. The commercial consequence—a QA hold, customer rejection, or shelf-life reduction—is already locked in.
Business impact
- The operational 'chaos tax' of an excursion includes diverting QA resources for investigation, paying for emergency lab tests, and customer service overtime managing stock availability queries for quarantined inventory.
- A single significant excursion can place hundreds of pallets under a QA hold, creating phantom inventory that exists in the WMS but is legally unshippable. This directly causes stock-outs and broken customer service commitments.
Formula
(Excursion shipments / Total cold chain shipments) x 100Grain
One row per shipment/transport load — carrier × route × plant × customer × date
Inside the Implementation Pack
A preview of what's actually built for this KPI — extracted from the real Implementation Pack, not a mockup.
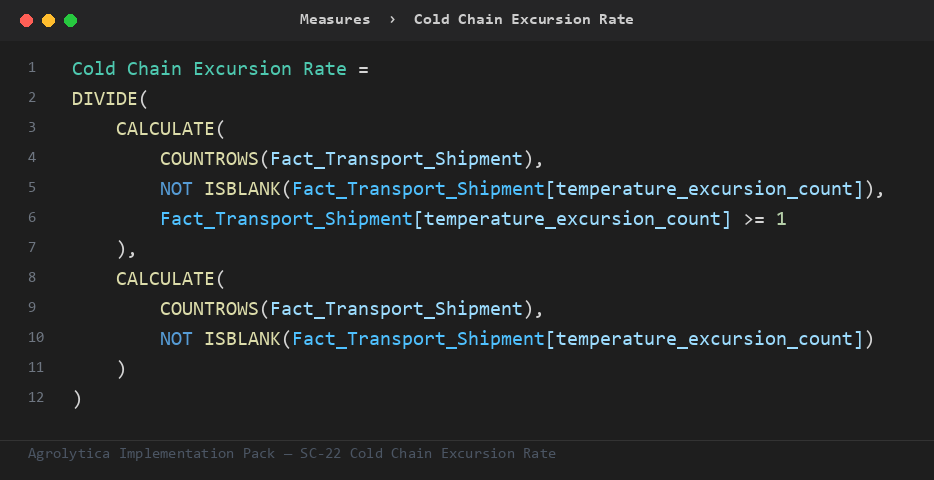
This is the primary ratio the pack's other measures build on — trend, rank, and period-comparison variants, all on Fact_Transport_Shipment. It guards against missing dates and values with NOT ISBLANK checks.
Fact_Transport_Shipment— 7 mandatory columns — temperature excursion count, shipment count, ...Dim_Carrier— key + nameDim_Customer— key + nameDim_Plant— key + nameDim_Route— key + nameDim_Date— Auto-generated calendar table — no customer data required
Full field-by-field data contract, in 4 SQL dialects (SQL Server, Snowflake, Databricks, BigQuery), ships in the pack.
| Target | 0.005 — performance considered compliant at or below this line |
| Warning | 0.015 — amber alert — triggers a review |
Both live in one Excel tab — change them, refresh the report, done. No DAX editing needed.
Everything you need to build Cold Chain Excursion Rate in Power BI — dimensional model, DAX measures, SQL views, and a food-industry demo dataset.