What it measures
Actual commodity cost vs budgeted commodity cost
The index measures cost variance after the commodity has been purchased and invoiced; the procurement decisions and market movements that drove the result occurred weeks or months prior.
Business impact
- Increased 'chaos tax': unbudgeted cash deployed to cover margin calls on hedging positions or to fund panic buys, starving other parts of the business of working capital.
- Adverse variance forces a choice between holding excess inventory to buffer against future price rises—destroying cash—or running lean and risking a stock-out that breaks a customer service commitment.
Formula
(Actual commodity cost / Budget commodity cost) x 100- Actual Commodity Cost per Tonne
- Total paid price per tonne for a specific commodity in the reporting period. Includes all-in delivered cost (freight, duties, insurance). Excludes: currency translation effects, surcharges classified separately as logistics costs.
- Budgeted Commodity Cost per Tonne
- The standard cost per tonne for the equivalent volume, as approved in the annual operating plan or rolling forecast. This is the financial baseline against which performance is measured.
Grain
One row per purchase order line — commodity × supplier × material × plant × date
Inside the Implementation Pack
A preview of what's actually built for this KPI — extracted from the real Implementation Pack, not a mockup.
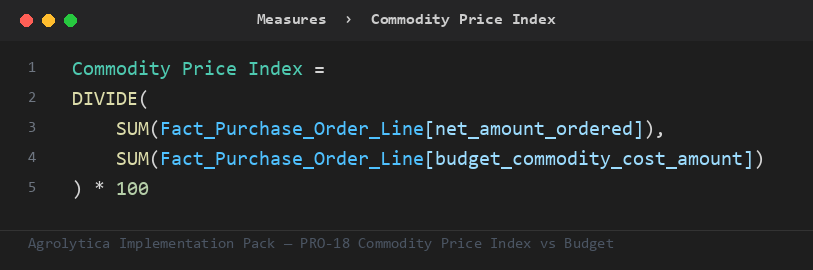
This is the primary ratio the pack's other measures build on — trend, rank, and period-comparison variants, all on Fact_Purchase_Order_Line.
Fact_Purchase_Order_Line— 7 mandatory columns — commodity key, plant key, ...Dim_Commodity— key + nameDim_Material— material_key + material_descriptionDim_Plant— key + nameDim_Supplier— key + nameDim_Date— Auto-generated calendar table — no customer data required
Full field-by-field data contract, in 4 SQL dialects (SQL Server, Snowflake, Databricks, BigQuery), ships in the pack.
| Target | 100 — reference value for this KPI |
| Warning | 105 — amber alert — triggers a review |
Both live in one Excel tab — change them, refresh the report, done. No DAX editing needed.
Everything you need to build Commodity Price Index vs Budget in Power BI — dimensional model, DAX measures, SQL views, and a food-industry demo dataset.