What it measures
Number of consumer complaints per million units sold
a complaint is registered weeks or months after the production failure occurred and the product was shipped. It confirms a past failure, it does not predict a future one.
Business impact
- Triggers a 'chaos tax' of unplanned activity: diverting senior quality and R&D personnel to firefighting, executing emergency batch holds, and funding unplanned traceability exercises.
- Sustained high complaint rates or a single major safety incident moves a supplier into the commercial red zone, facing a formal service improvement plan as the final step before delisting.
Formula
(Complaints / Units sold) x 1,000,000Grain
One row per billing document line — customer × product × plant × billing date
Inside the Implementation Pack
A preview of what's actually built for this KPI — extracted from the real Implementation Pack, not a mockup.
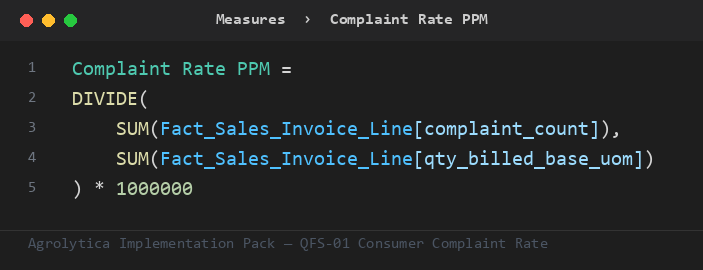
This is the primary ratio the pack's other measures build on — trend, rank, and period-comparison variants, all on Fact_Sales_Invoice_Line.
Fact_Sales_Invoice_Line— 7 mandatory columns — billing date key, customer key, ...Dim_Currency— currency_key + currency_codeDim_Customer— key + nameDim_Plant— key + nameDim_Product— key + nameDim_Date— Auto-generated calendar table — no customer data required
Full field-by-field data contract, in 4 SQL dialects (SQL Server, Snowflake, Databricks, BigQuery), ships in the pack.
| Target | 30 — performance considered compliant at or below this line |
| Warning | 60 — amber alert — triggers a review |
Both live in one Excel tab — change them, refresh the report, done. No DAX editing needed.
Everything you need to build Consumer Complaint Rate in Power BI — dimensional model, DAX measures, SQL views, and a food-industry demo dataset.