What it measures
Rate of lost time injuries per million hours worked
LTIFR measures injuries after they have occurred and resulted in lost work time. The operational failure and its direct costs are already locked in before the metric is calculated.
Business impact
- Increased 'chaos tax' from unplanned absence: supervisors spend hours re-allocating labor to maintain shift coverage, while HR scrambles to find last-minute agency labor at premium rates.
- Degraded labor or line capacity. Every lost time injury removes a skilled operator, forcing reliance on less experienced staff, which lowers throughput, compromises quality, and increases the risk of further safety incidents.
Formula
(LTIs x 1,000,000) / Total hours workedGrain
One row per HSE incident or observation event — employee × site × plant × equipment × date
Inside the Implementation Pack
A preview of what's actually built for this KPI — extracted from the real Implementation Pack, not a mockup.
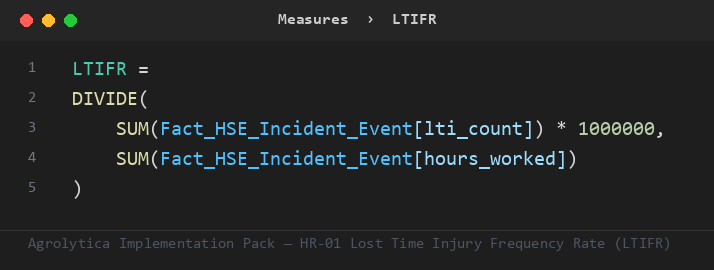
This is the primary ratio the pack's other measures build on — trend, rank, and period-comparison variants, all on Fact_HSE_Incident_Event.
Fact_HSE_Incident_Event— 7 mandatory columns — hours worked, plant key, ...Dim_Employee— key + nameDim_Equipment— key + nameDim_Plant— key + nameDim_Site— key + nameDim_Date— Auto-generated calendar table — no customer data required
Full field-by-field data contract, in 4 SQL dialects (SQL Server, Snowflake, Databricks, BigQuery), ships in the pack.
| Target | 0.5 — performance considered compliant at or below this line |
| Warning | 2.75 — amber alert — triggers a review |
Both live in one Excel tab — change them, refresh the report, done. No DAX editing needed.
Everything you need to build Lost Time Injury Frequency Rate (LTIFR) in Power BI — dimensional model, DAX measures, SQL views, and a food-industry demo dataset.