What it measures
Near miss and observation reports per employee per month
This is a leading indicator. A fall in the observation rate signals workforce disengagement today that predicts a rise in recordable safety incidents within the next 1-3 months.
Business impact
- Increased 'chaos tax' from unmanaged risks: line stoppages to investigate minor incidents, unplanned maintenance on failing equipment, and HR time spent on disciplinary actions that could have been preventive coaching.
- Higher workers' compensation premiums and rising absence rates driven by unaddressed ergonomic and fatigue risks, directly impacting labor cost and shift coverage.
Formula
Observations submitted / FTE countGrain
One row per employee per month — employee × site × plant × cost centre × period
Inside the Implementation Pack
A preview of what's actually built for this KPI — extracted from the real Implementation Pack, not a mockup.
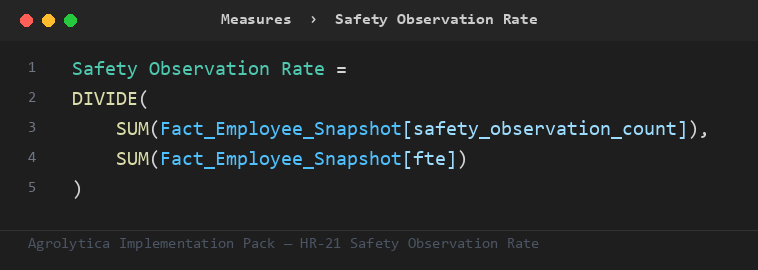
This is the primary ratio the pack's other measures build on — trend, rank, and period-comparison variants, all on Fact_Employee_Snapshot.
Fact_Employee_Snapshot— 7 mandatory columns — period key, safety observation count, ...Dim_Cost_Center— key + nameDim_Employee— key + nameDim_Period— key + nameDim_Plant— key + nameDim_Site— key + nameDim_Date— Auto-generated calendar table — no customer data required
Full field-by-field data contract, in 4 SQL dialects (SQL Server, Snowflake, Databricks, BigQuery), ships in the pack.
| Target | 1 — performance considered compliant at or above this line |
| Warning | 0.5 — amber alert — triggers a review |
Both live in one Excel tab — change them, refresh the report, done. No DAX editing needed.
Everything you need to build Safety Observation Rate in Power BI — dimensional model, DAX measures, SQL views, and a food-industry demo dataset.