What it measures
OEE measured against 24/7 calendar time
TEEP measures the historical productivity of capital assets against all available calendar time. By the time the monthly score is calculated, the opportunity to generate revenue in that period is gone and the poor return on assets is already locked in.
Business impact
- Increased 'chaos tax' from mistaking low utilisation for low capacity, leading to unnecessary overtime, weekend shifts, and building finished goods inventory to buffer against a problem that isn't there.
Formula
Availability x Performance x Quality vs 24/7 calendar- OEE (Overall Equipment Effectiveness)
- Calculated as Availability x Performance x Quality. Measures effectiveness only during scheduled production time.
- Utilisation
- Calculated as Scheduled Production Time / Total Calendar Time. Measures how much of the total available time was actually used for production.
Grain
One row per production line per shift per run — plant × line × product × shift × date
Inside the Implementation Pack
A preview of what's actually built for this KPI — extracted from the real Implementation Pack, not a mockup.
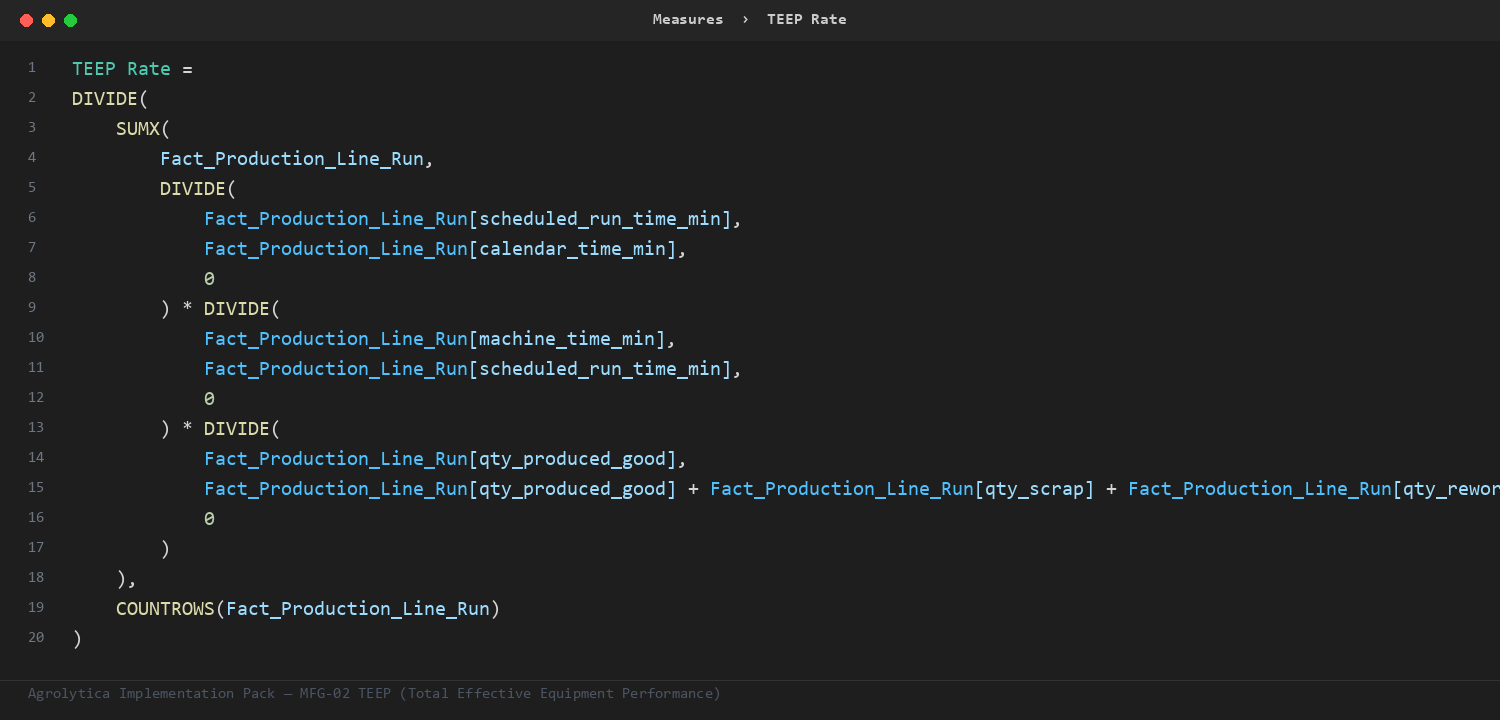
This is the primary ratio the pack's other measures build on — trend, rank, and period-comparison variants, all on Fact_Production_Line_Run.
Fact_Production_Line_Run— 14 mandatory columns — plant key, date key, ...Dim_Plant— key + nameDim_Product— key + nameDim_Production_Line— key + nameDim_Shift— key + nameDim_Work_Center— key + nameDim_Date— Auto-generated calendar table — no customer data required
Full field-by-field data contract, in 4 SQL dialects (SQL Server, Snowflake, Databricks, BigQuery), ships in the pack.
| Target | 0.7 — performance considered compliant at or above this line |
| Warning | 0.55 — amber alert — triggers a review |
Both live in one Excel tab — change them, refresh the report, done. No DAX editing needed.
Everything you need to build TEEP (Total Effective Equipment Performance) in Power BI — dimensional model, DAX measures, SQL views, and a food-industry demo dataset.