What it measures
Combined measure of availability, performance and quality
OEE is a historical record of asset performance. It is calculated after a production run is complete, meaning the time, speed, and quality losses it measures have already been incurred and converted into waste or unabsorbed overhead.
Business impact
- Increased 'chaos tax' from running lines into overtime to meet schedules, paying premium rates for agency labor, and incurring higher energy costs per unit produced.
- Unstable OEE creates an unpredictable inventory position, forcing the business to carry excess safety stock as a buffer, which ties up cash and increases the risk of product write-offs.
Formula
Availability % x Performance % x Quality %- Availability
(Scheduled Production Time - Unplanned Downtime) / Scheduled Production Time— The percentage of scheduled time that the equipment is available to operate. Excludes planned stops like scheduled maintenance, sanitation windows (CIP), or meal breaks.- Performance
Actual Output / (Operating Time x Ideal Cycle Time)— The speed at which the equipment runs as a percentage of its designed speed (nameplate capacity). Accounts for minor stops and reduced speed.- Quality
Good Units / Total Units Produced— The percentage of units produced that meet quality standards without needing rework. Captures startup rejects and in-process defects.
Grain
One row per production line per shift per run — plant × production line × product × shift × date
Inside the Implementation Pack
A preview of what's actually built for this KPI — extracted from the real Implementation Pack, not a mockup.
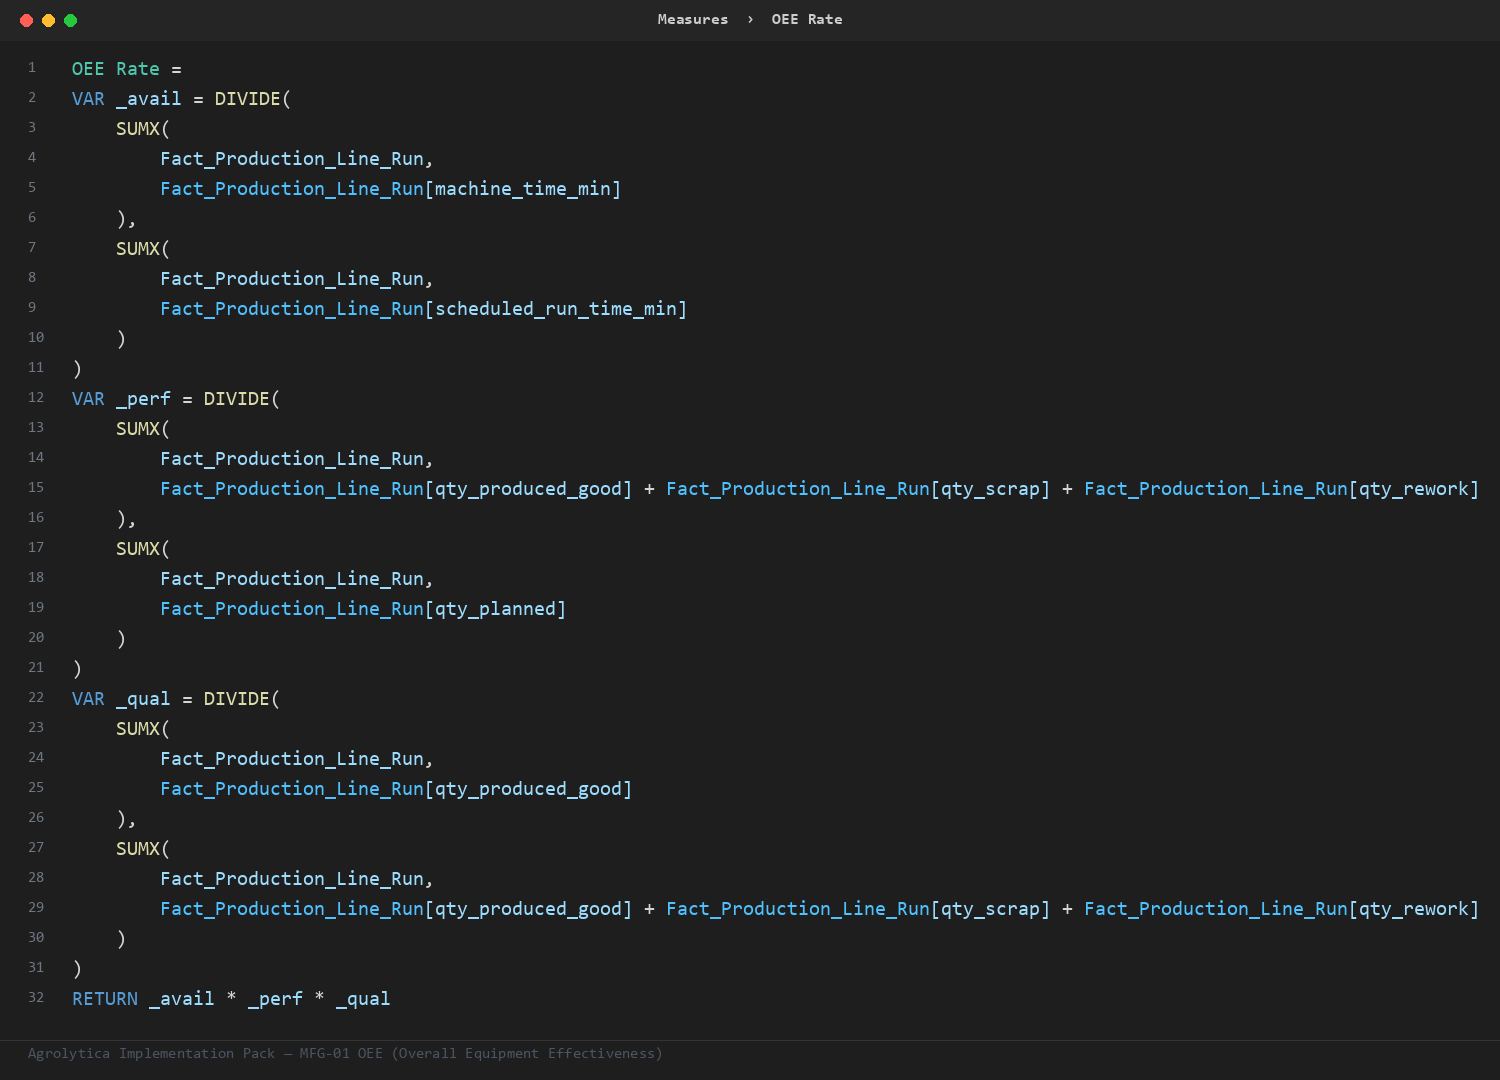
This is the primary ratio the pack's other measures build on — trend, rank, and period-comparison variants, all on Fact_Production_Line_Run. It uses VAR/RETURN to keep the logic readable instead of one giant nested expression.
Fact_Production_Line_Run— 13 mandatory columns — qty planned, qty rework, ...Dim_Plant— key + nameDim_Product— key + nameDim_Production_Line— key + nameDim_Shift— key + nameDim_Work_Center— key + nameDim_Date— Auto-generated calendar table — no customer data required
Full field-by-field data contract, in 4 SQL dialects (SQL Server, Snowflake, Databricks, BigQuery), ships in the pack.
| Target | 0.82 — performance considered compliant at or above this line |
| Warning | 0.68 — amber alert — triggers a review |
Both live in one Excel tab — change them, refresh the report, done. No DAX editing needed.
Everything you need to build OEE (Overall Equipment Effectiveness) in Power BI — dimensional model, DAX measures, SQL views, and a food-industry demo dataset.