What it measures
Total transport cost relative to net revenue
it measures the financial outcome of deliveries already completed. The costs are typically invoiced and booked 30-45 days after the physical transport occurs, confirming the cost of past operational decisions.
Business impact
- A 1-point increase from 7% to 8% can erase over 10% of the net margin on a product line, driven by unplanned LTL shipments and premium freight to prevent retailer service penalties — felt first by the Finance Controller.
- Higher 'chaos tax' from last-minute changes: premium freight to meet tight dock booking windows, carrier waiting-time penalties, and the cost of redelivering failed or rejected orders.
- Poor inventory position at a regional DC forces expensive cross-country stock transfers or direct-from-factory shipments, consuming cash and bypassing the planned, cost-effective distribution network.
- A consistently high cost-to-serve for a specific account triggers a formal profitability review, putting the entire product range on a path to reduction or total delisting.
Formula
(Total transport cost / Net revenue) x 100Grain
One row per billing document line — customer x product x plant x date
Inside the Implementation Pack
A preview of what's actually built for this KPI — extracted from the real Implementation Pack, not a mockup.
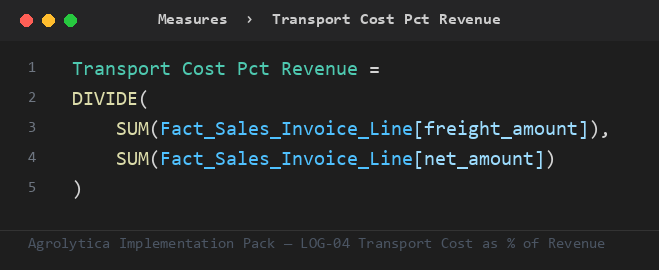
This is the primary ratio the pack's other measures build on — trend, rank, and period-comparison variants, all on Fact_Sales_Invoice_Line.
Fact_Sales_Invoice_Line— 7 mandatory columns — customer key, freight amount, ...Dim_Currency— currency_key + currency_codeDim_Customer— key + nameDim_Plant— key + nameDim_Product— key + nameDim_Date— Auto-generated calendar table — no customer data required
Full field-by-field data contract, in 4 SQL dialects (SQL Server, Snowflake, Databricks, BigQuery), ships in the pack.
| Target | 0.03 — performance considered compliant at or below this line |
| Warning | 0.06 — amber alert — triggers a review |
Both live in one Excel tab — change them, refresh the report, done. No DAX editing needed.
Everything you need to build Transport Cost as % of Revenue in Power BI — dimensional model, DAX measures, SQL views, and a food-industry demo dataset.