What it measures
% of truck capacity used per delivery
It measures the outcome of past planning and order consolidation decisions; the transport cost is already committed by the time the truck is dispatched and the rate is calculated.
Business impact
- A 1-point drop in utilisation across the fleet translates to a 1.1-1.2% increase in cost-to-serve, as fixed vehicle and driver costs are spread over fewer units — felt first by the Finance Controller seeing transport costs exceed budget.
- Increased 'chaos tax' from last-minute, partially-filled shipments that require premium spot-market rates, bypassing contracted carrier agreements and destroying the transport budget.
- Wasted working capital in the form of fuel and driver hours spent transporting air, particularly in temperature-controlled reefer trucks where the refrigeration unit consumes fuel regardless of load factor.
- Persistently low utilisation forces cost-cutting consolidations that risk missing retailer dock booking windows, triggering penalty invoices and a formal service improvement plan.
Formula
(Actual load volume / Full truck capacity) x 100Grain
One row per shipment/transport load — carrier × route × plant × customer × date
Inside the Implementation Pack
A preview of what's actually built for this KPI — extracted from the real Implementation Pack, not a mockup.
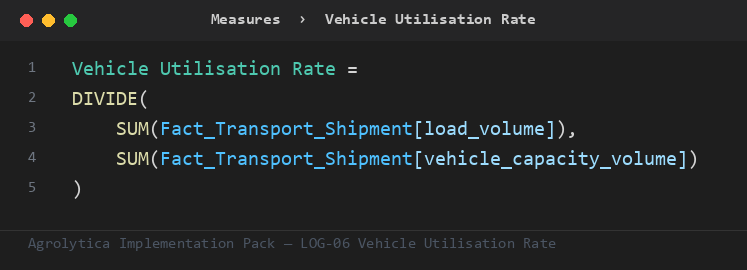
This is the primary ratio the pack's other measures build on — trend, rank, and period-comparison variants, all on Fact_Transport_Shipment.
Fact_Transport_Shipment— 7 mandatory columns — vehicle capacity volume, load volume, ...Dim_Carrier— key + nameDim_Customer— key + nameDim_Plant— key + nameDim_Route— key + nameDim_Date— Auto-generated calendar table — no customer data required
Full field-by-field data contract, in 4 SQL dialects (SQL Server, Snowflake, Databricks, BigQuery), ships in the pack.
| Target | 0.96 — performance considered compliant at or above this line |
| Warning | 0.83 — amber alert — triggers a review |
Both live in one Excel tab — change them, refresh the report, done. No DAX editing needed.
Everything you need to build Vehicle Utilisation Rate in Power BI — dimensional model, DAX measures, SQL views, and a food-industry demo dataset.