What it measures
% of outbound shipments consolidated vs single-drop
Business impact
- Increased 'chaos tax' from last-minute Less-Than-Truckload (LTL) bookings at premium rates to meet customer service commitments that ignore logistics reality.
- Higher inventory position at regional cross-docking hubs, as stock is held longer in an attempt to build consolidated loads, increasing working capital and risk of spoilage.
- Sustained low consolidation drives cost-to-serve above the category average, making your pricing uncompetitive and putting you in the commercial red zone for range reviews.
Formula
(Consolidated shipments / Total outbound) x 100Grain
One row per shipment/transport load
Inside the Implementation Pack
A preview of what's actually built for this KPI — extracted from the real Implementation Pack, not a mockup.
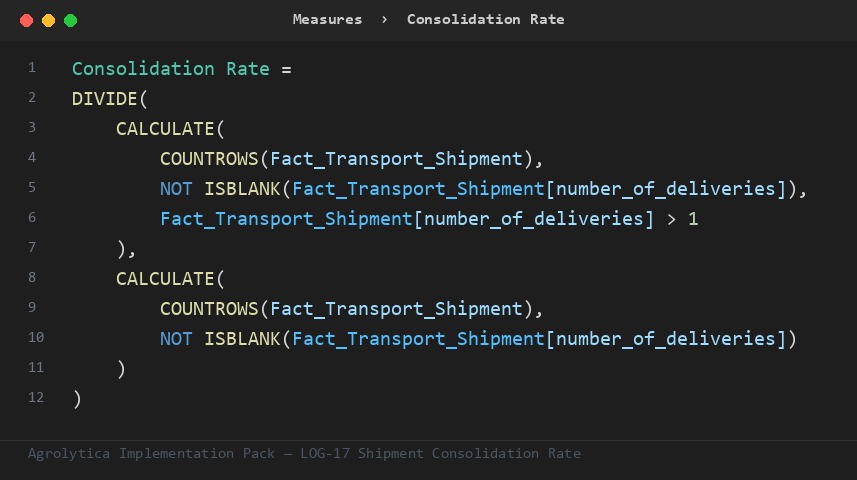
This is the primary ratio the pack's other measures build on — trend, rank, and period-comparison variants, all on Fact_Transport_Shipment. It guards against missing dates and values with NOT ISBLANK checks.
Fact_Transport_Shipment— 7 mandatory columns — route key, customer key, ...Dim_Carrier— key + nameDim_Customer— key + nameDim_Plant— key + nameDim_Route— key + nameDim_Date— Auto-generated calendar table — no customer data required
Full field-by-field data contract, in 4 SQL dialects (SQL Server, Snowflake, Databricks, BigQuery), ships in the pack.
| Target | 0.65 — performance considered compliant at or above this line |
| Warning | 0.4 — amber alert — triggers a review |
Both live in one Excel tab — change them, refresh the report, done. No DAX editing needed.
Everything you need to build Shipment Consolidation Rate in Power BI — dimensional model, DAX measures, SQL views, and a food-industry demo dataset.