What it measures
Actual volume sold vs budgeted volume
it measures the outcome of commercial plans after the sales period has closed, confirming whether the budget was met or missed. The financial consequences are already locked in.
Business impact
- Each 1% volume shortfall below budget increases unit production cost by spreading fixed overheads over fewer cases and raises the risk of inventory write-offs for date-sensitive products.
- Persistent shortfalls trigger a 'chaos tax' of reactive planning: short-notice production schedule changes, wasted raw materials from cancelled runs, and premium charges for last-minute marketing changes.
- A significant volume miss directly creates an unplanned finished goods inventory position, tying up cash and warehouse space with stock produced for sales that never materialised, increasing shelf-life pressure.
- Sustained volume shortfalls of >10% for two consecutive quarters against the joint business plan triggers a formal category review and puts the product's core listing at risk.
Formula
(Actual volume / Budget volume) x 100Grain
One row per SKU per location per forecast version per period
Inside the Implementation Pack
A preview of what's actually built for this KPI — extracted from the real Implementation Pack, not a mockup.
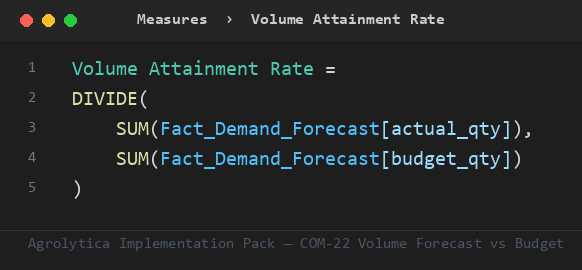
This is the primary ratio the pack's other measures build on — trend, rank, and period-comparison variants, all on Fact_Demand_Forecast.
Fact_Demand_Forecast— 9 mandatory columns — period key, product key, ...Dim_Customer— key + nameDim_Forecast_Version— key + nameDim_Material— material_key + material_descriptionDim_Period— key + nameDim_Plant— key + nameDim_Product— key + nameDim_Date— Auto-generated calendar table — no customer data required
Full field-by-field data contract, in 4 SQL dialects (SQL Server, Snowflake, Databricks, BigQuery), ships in the pack.
| Target | 1 — reference value for this KPI |
| Warning | 0.92 — amber alert — triggers a review |
Both live in one Excel tab — change them, refresh the report, done. No DAX editing needed.
Everything you need to build Volume Forecast vs Budget in Power BI — dimensional model, DAX measures, SQL views, and a food-industry demo dataset.