What it measures
% of scheduled working days lost to absence
the rate measures absences that have already occurred. The operational consequences, such as overtime costs and production shortfalls, are locked in before the metric is reported.
Business impact
- Increased 'chaos tax' from last-minute production schedule changes, supervisor time spent finding cover, and the use of less-skilled agency labor which reduces line efficiency and increases quality risk.
- Unplanned gaps in labor or line capacity lead to production shortfalls, impacting the site's ability to build a stable inventory position and forcing reliance on safety stock to meet customer service commitments.
- Chronic absenteeism on critical lines directly causes short-shipped orders. Three consecutive failures risk triggering a formal retailer service improvement plan, the final warning before range removal.
Formula
(Absent days / Scheduled working days) x 100Grain
One row per employee per month — employee × site × plant × cost centre × period
Inside the Implementation Pack
A preview of what's actually built for this KPI — extracted from the real Implementation Pack, not a mockup.
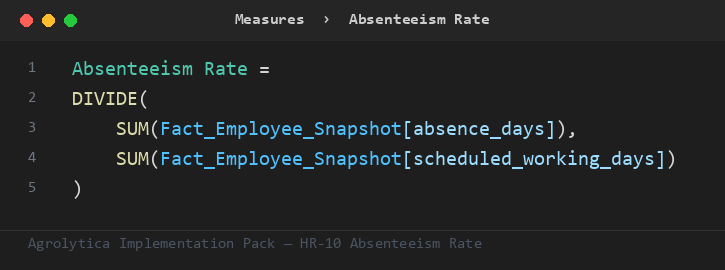
This is the primary ratio the pack's other measures build on — trend, rank, and period-comparison variants, all on Fact_Employee_Snapshot.
Fact_Employee_Snapshot— 7 mandatory columns — site key, employee key, ...Dim_Cost_Center— key + nameDim_Employee— key + nameDim_Period— key + nameDim_Plant— key + nameDim_Site— key + nameDim_Date— Auto-generated calendar table — no customer data required
Full field-by-field data contract, in 4 SQL dialects (SQL Server, Snowflake, Databricks, BigQuery), ships in the pack.
| Target | 0.03 — performance considered compliant at or below this line |
| Warning | 0.05 — amber alert — triggers a review |
Both live in one Excel tab — change them, refresh the report, done. No DAX editing needed.
Everything you need to build Absenteeism Rate in Power BI — dimensional model, DAX measures, SQL views, and a food-industry demo dataset.