What it measures
% of employees voluntarily leaving
it measures departures that have already occurred. The operational consequences, such as reduced line capacity and increased recruitment costs, typically manifest 4–8 weeks after the turnover spike.
Business impact
- Increased 'chaos tax' from lost institutional knowledge: new hires and temporary staff cause more line stoppages, mis-picks, and minor safety incidents, disrupting production flow and requiring constant supervisor intervention.
- Degraded labor or line capacity as open positions remain unfilled or are covered by less productive agency staff, directly reducing plant throughput and jeopardizing customer service commitments.
- Sustained high turnover signals an unstable operation to customers and auditors, increasing scrutiny during site visits and potentially triggering a review of supplier status for major retail accounts.
Formula
(Voluntary departures / Average headcount) x 100Grain
One row per employee per month — employee × site × cost centre × period
Inside the Implementation Pack
A preview of what's actually built for this KPI — extracted from the real Implementation Pack, not a mockup.
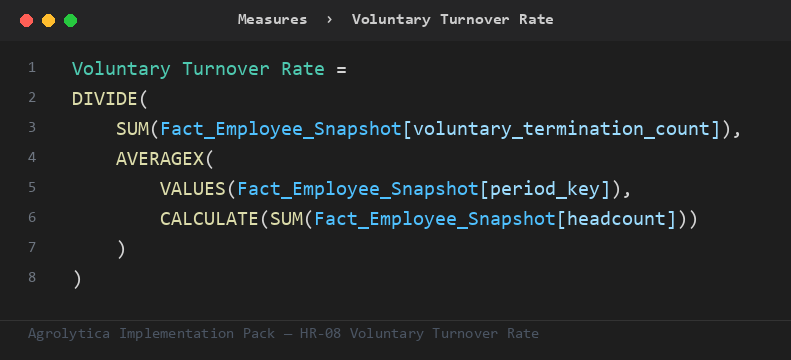
This is the primary ratio the pack's other measures build on — trend, rank, and period-comparison variants, all on Fact_Employee_Snapshot.
Fact_Employee_Snapshot— 8 mandatory columns — headcount, plant key, ...Dim_Cost_Center— key + nameDim_Employee— key + nameDim_Period— key + nameDim_Plant— key + nameDim_Site— key + nameDim_Date— Auto-generated calendar table — no customer data required
Full field-by-field data contract, in 4 SQL dialects (SQL Server, Snowflake, Databricks, BigQuery), ships in the pack.
| Target | 0.1 — performance considered compliant at or below this line |
| Warning | 0.2 — amber alert — triggers a review |
Both live in one Excel tab — change them, refresh the report, done. No DAX editing needed.
Everything you need to build Voluntary Turnover Rate in Power BI — dimensional model, DAX measures, SQL views, and a food-industry demo dataset.