What it measures
Labor equivalent of OEE for workforce productivity
Business impact
- Increased 'chaos tax' from chasing volume targets with an ineffective workforce: higher agency labor costs, excessive overtime, and increased supervisor intervention to firefight line issues.
- Erosion of standard cost models. When OLE is low, actual labor cost per unit exceeds the standard, creating unfavorable variances that directly reduce gross margin on every pallet produced.
Formula
Labor Availability x Performance x Quality- Labor Availability
- (Actual Hours Worked / Total Hours Paid) x 100. Measures the percentage of paid time that operators are actually working, excluding paid breaks, meetings, or unassigned time.
- Performance
- (Standard Hours Earned for Units Produced / Actual Hours Worked) x 100. Measures how operators performed against standard run rates during the time they were working.
- Quality
- (Good Units Produced / Total Units Produced) x 100. Measures the percentage of units that meet quality specification first time, without rework.
Grain
One row per production line per shift per run — employee × production line × shift × date
Inside the Implementation Pack
A preview of what's actually built for this KPI — extracted from the real Implementation Pack, not a mockup.
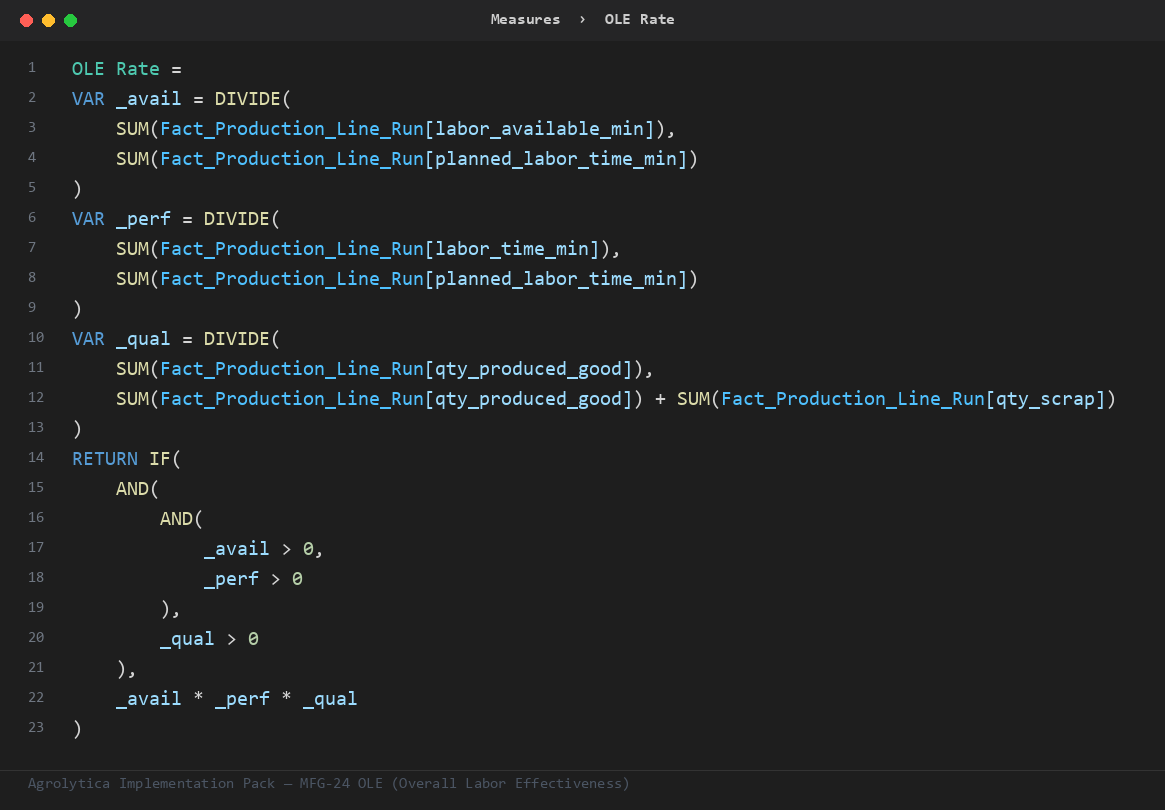
This is the primary ratio the pack's other measures build on — trend, rank, and period-comparison variants, all on Fact_Production_Line_Run. It uses VAR/RETURN to keep the logic readable instead of one giant nested expression.
Fact_Production_Line_Run— 13 mandatory columns — production line key, qty scrap, ...Dim_Employee— key + nameDim_Plant— key + nameDim_Product— key + nameDim_Production_Line— key + nameDim_Shift— key + nameDim_Work_Center— key + nameDim_Date— Auto-generated calendar table — no customer data required
Full field-by-field data contract, in 4 SQL dialects (SQL Server, Snowflake, Databricks, BigQuery), ships in the pack.
| Target | 0.85 — performance considered compliant at or above this line |
| Warning | 0.7 — amber alert — triggers a review |
Both live in one Excel tab — change them, refresh the report, done. No DAX editing needed.
Everything you need to build OLE (Overall Labor Effectiveness) in Power BI — dimensional model, DAX measures, SQL views, and a food-industry demo dataset.