What it measures
Average training hours per employee per year
it measures training that has already occurred. Its value is in correlating past investment (or lack thereof) with subsequent operational failures like safety incidents or quality holds, which typically manifest weeks or months later.
Business impact
- Increased 'chaos tax' from operator error: line stoppages, batch rework, and supervisor time spent firefighting instead of coaching, all stemming from cancelled or ineffective training.
- Degraded inventory position as poorly trained operators on critical control points (e.g., seal integrity, allergen control) cause quality defects, leading to entire production runs being placed on QA hold.
- Sustained under-investment in mandatory training places the site in the delisting zone. A major retailer audit revealing systemic gaps in food safety or HACCP records triggers a formal remediation plan, the final step before contract termination.
Formula
Total training hours / FTE countGrain
One row per employee per month — employee × site × plant × cost centre × period
Inside the Implementation Pack
A preview of what's actually built for this KPI — extracted from the real Implementation Pack, not a mockup.
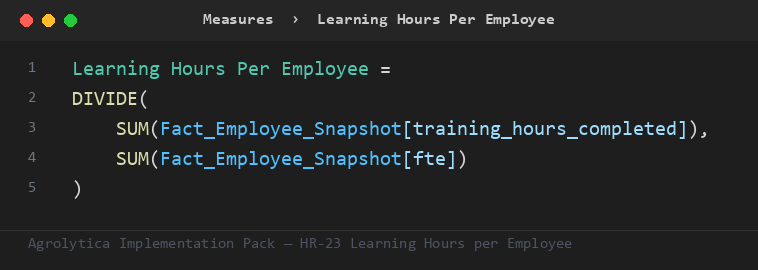
This is the primary ratio the pack's other measures build on — trend, rank, and period-comparison variants, all on Fact_Employee_Snapshot.
Fact_Employee_Snapshot— 7 mandatory columns — employee key, cost center key, ...Dim_Cost_Center— key + nameDim_Employee— key + nameDim_Period— key + nameDim_Plant— key + nameDim_Site— key + nameDim_Date— Auto-generated calendar table — no customer data required
Full field-by-field data contract, in 4 SQL dialects (SQL Server, Snowflake, Databricks, BigQuery), ships in the pack.
| Target | 20 — performance considered compliant at or above this line |
| Warning | 12 — amber alert — triggers a review |
Both live in one Excel tab — change them, refresh the report, done. No DAX editing needed.
Everything you need to build Learning Hours per Employee in Power BI — dimensional model, DAX measures, SQL views, and a food-industry demo dataset.